| Year | Population | Source |
|---|---|---|
| 2021 | 1,010,899 | Statistics Canada |
| 2019 | 972,223 | Municipal census |
| 2016 | 899,447 | Municipal census |
| 2014 | 877,926 | Municipal census |
| 2012 | 817,498 | Municipal census |
| 2011 | 812,201 | Statistics Canada |
| 2009 | 782,439 | Municipal census |
| 2008 | 752,412 | Municipal census |
| 2006 | 730,372 | Statistics Canada |
| 2005 | 712,391 | Municipal census |
| 2001 | 666,104 | Statistics Canada |
Whether you’re researching a business plan or writing a history report, these Edmonton facts and resources can help.
Population History
2000 - Present
1975 - 1999
| Year | Population | Source |
|---|---|---|
| 1999 | 648,284 | Municipal census |
| 1996 | 616,306 | Statistics Canada |
| 1993 | 626,999 | Municipal census |
| 1992 | 618,195 | Municipal census |
| 1991 | 616,741 | Statistics Canada |
| 1990 | 605,538 | Municipal census |
| 1989 | 583,872 | Municipal census |
| 1987 | 576,249 | Municipal census |
| 1986 | 571,506 | Statistics Canada |
| 1983 | 560,085 | Municipal census |
| 1982 | 551,314 | Municipal census |
| 1981 | 521,205 | Statistics Canada |
| 1980 | 505,773 | Municipal census |
| 1979 | 491,359 | Municipal census |
| 1978 | 478,066 | Municipal census |
| 1977 | 471,474 | Municipal census |
| 1976 | 461,559 | Statistics Canada |
| 1975 | 451,635 | Municipal census |
General Annexation - January 1, 1982
1950 - 1974
| Year | Population | Source |
|---|---|---|
| 1974 | 445,691 | Municipal census |
| 1973 | 442,365 | Municipal census |
| 1972 | 441,530 | Municipal census |
| 1971 | 436,264 | Statistics Canada |
| 1970 | 429,750 | Municipal census |
| 1969 | 422,418 | Municipal census |
| 1968 | 410,105 | Municipal census |
| 1967 | 393,593 | Municipal census |
| 1966 | 381,230 | Statistics Canada |
| 1965 | 371,265 | Municipal census |
| 1964 | 311,804 | Municipal census |
| 1963 | 303,756 | Municipal census |
| 1962 | 294,967 | Municipal census |
| 1961 | 276,018 | Statistics Canada |
| 1960 | 269,314 | Municipal census |
| 1959 | 260,733 | Municipal census |
| 1958 | 252,131 | Municipal census |
| 1957 | 238,353 | Municipal census |
| 1956 | 223,549 | Statistics Canada |
| 1955 | 209,353 | Municipal census |
| 1954 | 197,836 | Municipal census |
| 1953 | 183,411 | Municipal census |
| 1952 | 169,196 | Municipal census |
| 1951 | 158,012 | Statistics Canada |
| 1950 | 148,861 | Municipal census |
Annexation of Jasper Place - August 17, 1964
Annexation of Beverly - December 30, 1961
1925 - 1949
| Year | Population | Source |
|---|---|---|
| 1949 | 137,469 | Municipal census |
| 1948 | 126,609 | Municipal census |
| 1947 | 118,541 | Municipal census |
| 1946 | 114,976 | Municipal census |
| 1945 | 111,745 | Municipal census |
| 1944 | 108,416 | Municipal census |
| 1943 | 105,536 | Municipal census |
| 1942 | 96,725 | Municipal census |
| 1941 | 93,924 | Statistics Canada |
| 1940 | 91,723 | Municipal census |
| 1939 | 90,419 | Municipal census |
| 1938 | 88,887 | Municipal census |
| 1937 | 87,034 | Municipal census |
| 1936 | 85,470 | Municipal census |
| 1935 | 82,634 | Municipal census |
| 1934 | 79,773 | Municipal census |
| 1933 | 79,231 | Municipal census |
| 1932 | 78,387 | Municipal census |
| 1931 | 79,059 | Statistics Canada |
| 1930 | 77,557 | Municipal census |
| 1929 | 74,298 | Municipal census |
| 1928 | 69,744 | Municipal census |
| 1927 | 67,083 | Municipal census |
| 1926 | 65,163 | Municipal census |
| 1925 | 65,378 | Municipal census |
1900 - 1924
| Year | Population | Source |
|---|---|---|
| 1924 | 63,160 | Municipal census |
| 1923 | 60,000 | Municipal census* |
| 1922 | 60,000 | Municipal census* |
| 1921 | 58,821 | Statistics Canada |
| 1920 | 61,045 | Municipal census |
| 1919 | 60,000 | Municipal census* |
| 1918 | 53,000 | Municipal census* |
| 1917 | 51,000 | Municipal census* |
| 1916 | 53,846 | Municipal census |
| 1915 | 59,339 | Municipal census |
| 1914 | 72,516 | Municipal census |
| 1913 | 67,243 | Municipal census |
| 1912 | 53,611 | Municipal census |
| 1911 | 24,900 | Statistics Canada |
| 1909 | 23,000 | Municipal census* |
| 1908 | 18,500 | Municipal census |
| 1906 | 14,088 | Municipal census |
| 1904 | 8,350 | Municipal census |
| 1903 | 6,995 | Municipal census |
| 1901 | 2,626 | Statistics Canada |
*Estimate
Annexation of Calder - 1917
Annexation of Strathcona - February 1, 1912 and
Annexation of North Edmonton - July 18, 1912
1878 - 1899
| Year | Population | Source |
|---|---|---|
| 1899 | 2,212 | Municipal census |
| 1897 | 1,638 | Municipal census |
| 1895 | 1,165 | Municipal census |
| 1892 | 700 | Municipal census |
| 1887 | 350 | Municipal census* |
| 1885 | 263 | Municipal census |
| 1878 | 148 | Municipal census |
*Estimate
The City of Edmonton provides this information in good faith but provides no warranty, nor accepts any liability arising from any incorrect, incomplete, or misleading information resulting from improper use.
Edmonton Symbols
Edmonton has several official symbols that have been carefully designed to represent our unique heritage and character. These symbols are an important part of our culture and should always be used in an appropriate and intended manner. If you have questions about the proper application of the standards, contact the Brand Team at brandteam@edmonton.ca.

Coat of Arms
The City Crest is an official symbol that reflects Edmonton’s history, geography and aspirations. The elements include:
- Mace: Edmonton’s preeminent status as Alberta’s capital city
- Sun emblazoned on the shield: Edmonton’s above-average amount of sunshine
- Winged wheel: Edmonton’s importance as an aviation and industrial centre
- Wavy ribbon: The North Saskatchewan River
- Sheaf: Agriculture
- Explorer (left): The city’s fur trading heritage
- Athena, Goddess of Wisdom (right): Education and the University of Alberta
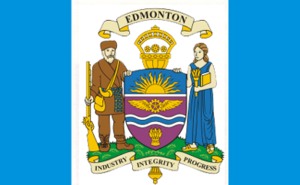
Flag
The flag incorporates the City of Edmonton Coat of Arms on a white field with two blue borders. The blue symbolizes strength and the North Saskatchewan River, and the white signifies peace.
![]()
Logo
The logo represents our organization, the City of Edmonton. The original City logo was developed in 1976 and adopted in 1977. In 2016, the logo was updated, retaining elements of the original but in a cleaner, more modern form. Consistent with our past, it makes our mark in a new way.

The Mayor’s Chain of Office
The Mayor wears the Mayor’s Chain of Office at ceremonial functions. Each link represents a community element and symbolizes people joined in a common cause. The chain rests on a prime beaver pelt, which recognizes Edmonton’s origins as a Hudson’s Bay Company Trading Post. The gold and silver badges represent military and police units that have served Edmonton.

City Tartan
The predominant colour in the City Tartan is light blue, which symbolizes the clear blue of the prairie sky. The green represents agriculture, while the yellow represents the sun of the long summer days and prairie wheat. The white represents peace, from the City flag, and for the long months of snow. The city’s official colours of purple and gold are also included, with the gold also representing the marigold, Edmonton’s official flower.

Official Flower: The Marigold
The marigold symbolizes sunny Alberta and Edmonton’s role in the Klondike Gold Rush of the 1890s. Like the flower’s many varieties, Edmonton is home to a vibrant medley of different cultures and backgrounds.